Spatial Analysis of UFO Reports
EXECUTIVE SUMMARY
+ Using spatial statistical analysis, I observe patterns of UFO reports across U.S. counties.
+ Population size, county size in acres, and the number of airstrips are all positively associated with sightings, as one would expect.
+ Nuclear facilities are associated with an increase in sightings in a county. Other energy facilities (such as petroleum plants) don’t appear to have the same effect.
+ Army, Navy, and Air Force bases are all associated with slightly fewer sightings.
+ A count of positive magnetic anomalies appear to have a positive effect on sightings in a county.
+ Gravitational anomalies appear to be suppress the number of sightings.
+ Elevation variation — a measure of “mountainousness” — is very strongly associated with increased sightings.
+ I observe three hotspots — the counties surrounding Phoenix, Seattle, and Myrtle Beach. Each county has many more sightings than expected by the model. Each area appears to have a distinct explosion of sightings at different time intervals. A future post will focus on temporal changes in UFO report frequency along these lines.
INTRODUCTION
The recent UFO reports presented to Congress has reignited interest in UFOs (now called UAPs… I use the term UFO throughout this informal post). Inspired by this paper presented to a conference in the 1975, this 2014 paper by French researchers, and this report by RAND, I decided to dig into UFO reports systematically as a kind of pet project on my own time. This is completely independent work — I was not asked or paid by anyone to do this. (However, if someone were to sponsor this work, there are numerous ways the data available can be analyzed, ranging from the regression models explained here to dynamic forecasting of future UFO reports based on historical patterns.)
My conceptual approach is to oscillate between my role as a sociologist and someone who has a general interest in whether we are being monitored by “a different form of life.” My own opinion on these reports is that most of these can be explained by natural or manmade objects. But, maybe there’s something to a small number of them. I am also interested, professionally, in how beliefs can spread through social networks, including in mass panic events. I’ll do my best to try to present two sides — one giving non-alien sources of statistical patterns in data, and another side giving alien-based explanations — backed with evidence from the models. Nothing I write here proves anything one way or another. The best evidence to me for the “alien theory” of UFOs is a robust, observable pattern in data, with a conceivable explanation that tracks with the potential motivations of another lifeform, that does not have an alternative prosaic explanation. Some of the results here do hint at robust evidence that trends in this direction, but I also give some reasons to be skeptical of these results, as one should be. I’ll occasionally explain my results as a conversation between the familiar and likeable believer/skeptic duo: Mulder and Scully from the X-Files.
Many maps of NUFORC UFO reports exist. Below is one I made from 1910-2014. I downloaded the data from here. You see a lot of reports on the coasts, in big cities,… this is a population map. It will be nice to see what the reports are after using population weights and other factors. To do this, I jump right into the spatial regression model used throughout this post.

I include population and other variables in this model using a Poisson regression model with L1 regularization (also called LASSO) of UFO counts across the United States for the entire time series (1910-2014). I model the reports at the county level for no other reason than it was easy and fast to link it with Census data. (If I get more time and resources to do this kind of work, I want to re-do this analysis at the block or block group level, which may address some potential aggregation bias. But, for now, let’s go with counties.)
POPULATION, COUNTY SIZE, AND AIRSTRIPS
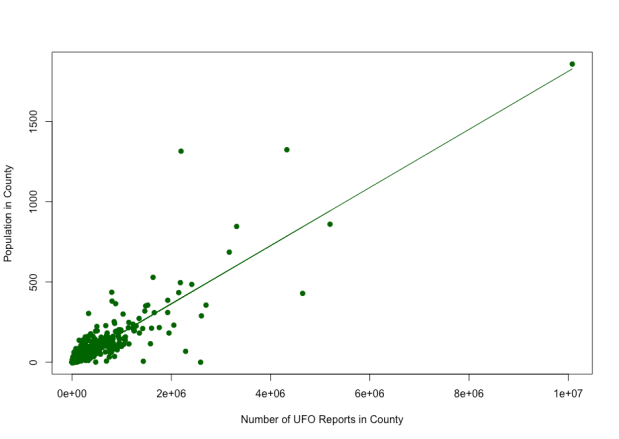
We first include population and county size in the model. Population size has a very strong positive effect on UFO reports in a county for obvious reasons: where there are more people, there are more people to report UFOs. One observation here, though, is that the models were very accurate at predicting county-level counts using only population as an input. If we look at a plot of population v. sightings, there is some error, but the linear fit is pretty accurate (an R^2 of .79 when linearly fitting raw sightings against population counts ). Mulder and Scully explain:
MULDER: Spatial analysis suggests that UFOs are pretty evenly distributed in the United States. No matter where you look, people report UFOs at nearly the same rate. They’re everywhere, Scully!
SCULLY: Places with more people will have more reports because people make the reports. It doesn’t mean they’re seeing UFOs. It just means that people are about as likely to report a UFO no matter where they live.
MULDER: Well, at least it shows that seeing a UFO isn’t specific to Mr. Yeehaw Up In the Holler or drunk tourists in Las Vegas. Think about all the differences in people across space — education, income, job types — between, say, urban and rural or the South/Midwest and coasts. Yet they report at about the same rate.
SCULLY: Well, no matter if they’re educated, rich, or poor; all observe the same basic information about UFOs. Everyone is aware of UFOs because of TV shows, movies, news reports. Just because someone is more educated doesn’t mean they’re less likely to misinterpret a kite as an alien sky orb. Also, the fact that UFOs don’t seem particularly interested in one place or another implies a lack of intelligence in these objects, yes? You would think that aliens would be interested in things that matter to their safety — military bases, for example.
MULDER: I’m so glad you said that, Scully. Next slide.
Next, let’s look at variables that may increase the chance that someone will view objects in the sky they can’t interpret. First: county size. I look at county size in order to detect a population density effect. People spread out over larger distances might have more open space to view weird things in the sky, increasing their rates of reports. I find that this is basically true (about 3% more counts for every logged unit of acres squared).
Another source of false positives for UFOs are conventional aircraft misinterpreted as otherworldly. I merge in the number of airstrips found in each county to try to account for this. I find that, as expected, the number of UFO reports increases with each additional airstrip (about 23% additional counts per airstrip in the county).
SCULLY: OK, I get it. So the model can tell us where people have reported more UFOs above and beyond a baserate for population. But the reports could still be mistaken.
MULDER: Maybe these are false positives, but maybe UFOs like to watch airplanes? Maybe little alien babies like to watch them take off and land?
SCULLY: *sighs* Next slide.
NUCLEAR PLANTS
The next few effects get a little more interesting. According to reports from some very credible witnesses, UFOs appear to be very interested in nuclear weapons. This would make sense if one takes the view that these are intelligent beings: nuclear weapons would be a major problem for just about any structure flying around in our airspace.
I don’t know where nukes are kept. These locations (to my knowledge) are a highly guarded secret. But, it’s possible that UFOs would be interested in nuclear energy more generally, if they’re interested in our fuel types and capacity. Nuclear plants’ locations in the US are public knowledge. So, I used a fantastic geospatial data resource with coordinates for nuclear weapons facilities and merged those into the model.
I found that UFOs are more likely to be reported around nuclear facilities, to the tune of about 15% more reports per nuclear plant in the county (the max is 2 facilities per county). This effect was not significant for petroleum plants, or total energy plants generally. It also replicates a separate 2014 study of UFOs by French researchers. Note that this nears the effect size for airstrips.
SCULLY: OK. Let’s say that this is a true effect, and not the result of some statistical artifact. Energy is important infrastructure. Maybe we have reconnaissance aircraft circling them for protection, or aircraft from a foreign nation are spying on them. Plus, nuclear weapons facilities do produce some pollution, which may create artifacts in the atmosphere or affect cognition.
MULDER: But wouldn’t all that also be the case for petroleum? Natural gas?
SCULLY: But an attack on a nuclear facility would potentially be more catastrophic. It would make sense that it would attract more attention from an adversary or need more protection from our military.
MULDER: You’re reaching.
SCULLY: So are you!
MILITARY BASES
Next, I try to test the assertion in the Congressional report on UAPs that these apparent craft appear to be around US military installations. I merge in coordinates for all Army, Navy, and Air Force bases in the US. I don’t find evidence for this assertion. Air Force, Navy, and Army installations are all slightly negatively associated (about 1-3% fewer per facility) with reports.
SCULLY: Well, that puts a wrench in your threat observation theory. Clearly these bases would be most interesting to an alien civilization observing our capabilities.
MULDER: These are civilian reports. Maybe UFOs use more signature management around these areas, or they’re less likely to be seen in civilian areas when in a county with a military base.
SCULLY: So would foreign military craft.
MULDER: Or, they see bases as less of a threat since they’d primarily be interested in nuclear power.
SCULLY: Surely they’d be interested in the tools to deploy nuclear weapons, including personnel.
MULDER: Well most of those tools like missles are kept in secret locations we can’t measure here. Also consider: AF bases often have experimental military craft, but the bases aren’t associated with increased reports. So, can we conclude that reports aren’t seeing experimental US aircraft?
SCULLY: Not all of the bases have experimental craft. Not all bases with people engineering experiment craft are publicly known. And the number of airstrips is already in the model, which includes AF bases. [test this]
GEOPHYSICAL ANOMALIES
The last batch of results test another aspect of anecdotal reports of UFOs: geophysical anomalies. A purported Canadian study was apparently interested in whether UFOs use the earth’s magnetic field for propulsion. I also have seen some speculation on gravity anomalies.
I found that the number of positive magnetic anomalies were positively associated with reported UFO sightings. Negative anomalies were not associated with higher reports. The counties with the highest amount of population magnetic anomalies saw about 50% higher rates of reports, though most of this effect was explained by including elevation in the model. After elevation is accounted for, magnetic anomalies were associated with about 10% higher rates of reports.
Elevation of land in the county — both in terms of the maximum elevation and elevation diversity (i.e., “mountainousness”), was associated with a massive increase in reports. The most elevation-variable counties were predicted to have nearly 300% higher rates of reports compared to the flattest. [explain blog post on mirages]
The last interesting effect is a surprisingly large effect for gravitational anomalies. Rates of UFO reports appear higher in those regions with fewer gravitational anomalies, after accounting for elevation.
MULDER: Maybe the Canadians were right. The alien crafts are using the Earth’s magnetic field for propulsion. Maybe they like the additional shielding from radiation that comes with positive magnetic anomalies. They like to hang out around mountains, and hate gravity anomalies because it disrupts the anti-gravity calibrations of their craft.
SCULLY: Models like these are always sensitive to unobserved variables and it’s aggregated to the county level. There could be unobserved variation within-counties, such as the within-county population distribution that correlates with increased magnetic anomalies. Think about it — volcanic material correlates with magnetic anomalies because of the mineral composition of the material. We’ve already seen that population density is inversely related to reports after accounting for population itself — what if there are within-county clusters of residents that can see vast fields of undeveloped land, increasing their propensity to see natural phenomena that look like alien craft. We’ve already seen variation in elevation erode away most of the effect, and the elevation measure is just a heuristic. What if —
MULDER: You’re losing the audience.
SCULLY: *sigh*
IDENTIFYING UFO HOTSPOTS USING MODEL RESIDUALS
The final models have about 86% accuracy in predicting county counts. In the [map below], we see that the model is very seldom surprised by the number of counts in a county. Though this is very highly predictive, there is still some variation to explain. It is potentially interesting to see which counties most surprised the model. This is called a “residual” analysis — in this case, looking at which counties had many more reports than expected by the model.

The county with the highest number of reports compared to model predictions was King County, Washington, the home of Seattle. King County had 220% more reports than predicted. Snohomish County, a Seattle neighbor, also made the top 5 list. Another Northwestern UFO report “hotspot” was Multnomah County, Oregon, home to Portland. The county saw about twice the number of predicted reports than what would be expected by the model. [explain drug paper]
Number two overall was New York County, New York, home of NYC. NYC is pretty far out on the population distribution, however, and I can imagine that many reports on the outskirts of the city might get attributed to New York (the county that holds Brooklyn, for example, has 0 reports, which is unbelievable). Personally, I think this is a statistical artifact, and goes to show the messiness in some of the data here.
The third place winner was Horry County, South Carolina. The county holds Myrtle Beach. The county has 545% more reports than predicted (300+ observed reports versus 55 predicted). This is by far the highest percentage difference in observed reports over expected among the counties listed here. I’ll go deeper into the Horry County case below.
Also making the top 5 is Maricopa County, Arizona, home of Phoenix. Phoenix was the setting of one of the most famous UFO sightings in the US, the Phoenix Lights.
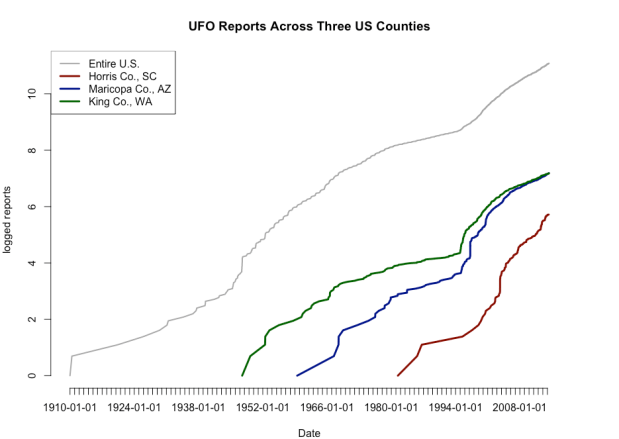
[A plot below] compares the national cumulative sum of reports with those of Horry, King, and Maricopa counties. All three counties have one thing in common: a sudden increase in sightings in a relatively short amount of time. In Phoenix, this increase corresponds with the Phoenix Lights (both before and after the Phoenix Lights). In King County, there was a separate increase just prior to the Phoenix Lights. And in Horry County, a separate explosion in sightings occurred in 2004-2005. In all three counties, the increase in the rate of reports leveled out, but remained higher than before the “flaps.” I’m interested in this as a sociologist, as this could represent mass events that endogenously affected future behavior — a type of social feedback that results in a persistent change to local society moving forward. In the next part of this series, I aim to try find other examples of these “flaps” which, depending on your priors, can be interpreted as a sociological phenomenon of social information flows and/or a genuine increase in UFO activity in a certain region.
CONCLUSION
I tried to systematically observe patterns of reports of UFOs across the US. Though the data are messy and likely full of inaccuracies, there could be signals that indicate interesting patterns in UFO sightings that are relevant to hardcore UFO believers or sociologists who care about the diffusion of information and panic through social networks.
Population size, county size, and the number of airstrips are easily interpretable as drivers of the number of reports per county. Less clear are the results found for nuclear plants, magnetic and gravity anomalies, and elevation diversity. The latter effects could be explained by model aggregation effects, atmospheric effects due to elevation, or other variable not observed. Some of these effects, however, especially the effect found for proximity to nuclear power plants, have reasonable explanations from [believers in alien theory of UFOs.]
I also looked at residuals of the model to determine which areas are particularly likely to have UFOs above and beyond what would be expected given the above factors. I found an interesting dynamic between the total number of reports and a brief explosion of reports consistent with either a mass panic event or an actual UFO flap (personally, I like the mass panic theory, but I’m biased as a sociologist who also likes the razor of Occam).
The identification of these “flaps” will segue into Part 2 of this analysis, whenever I get to it, on the robust detection of temporally brief, large-scale sightings in a particular area.
